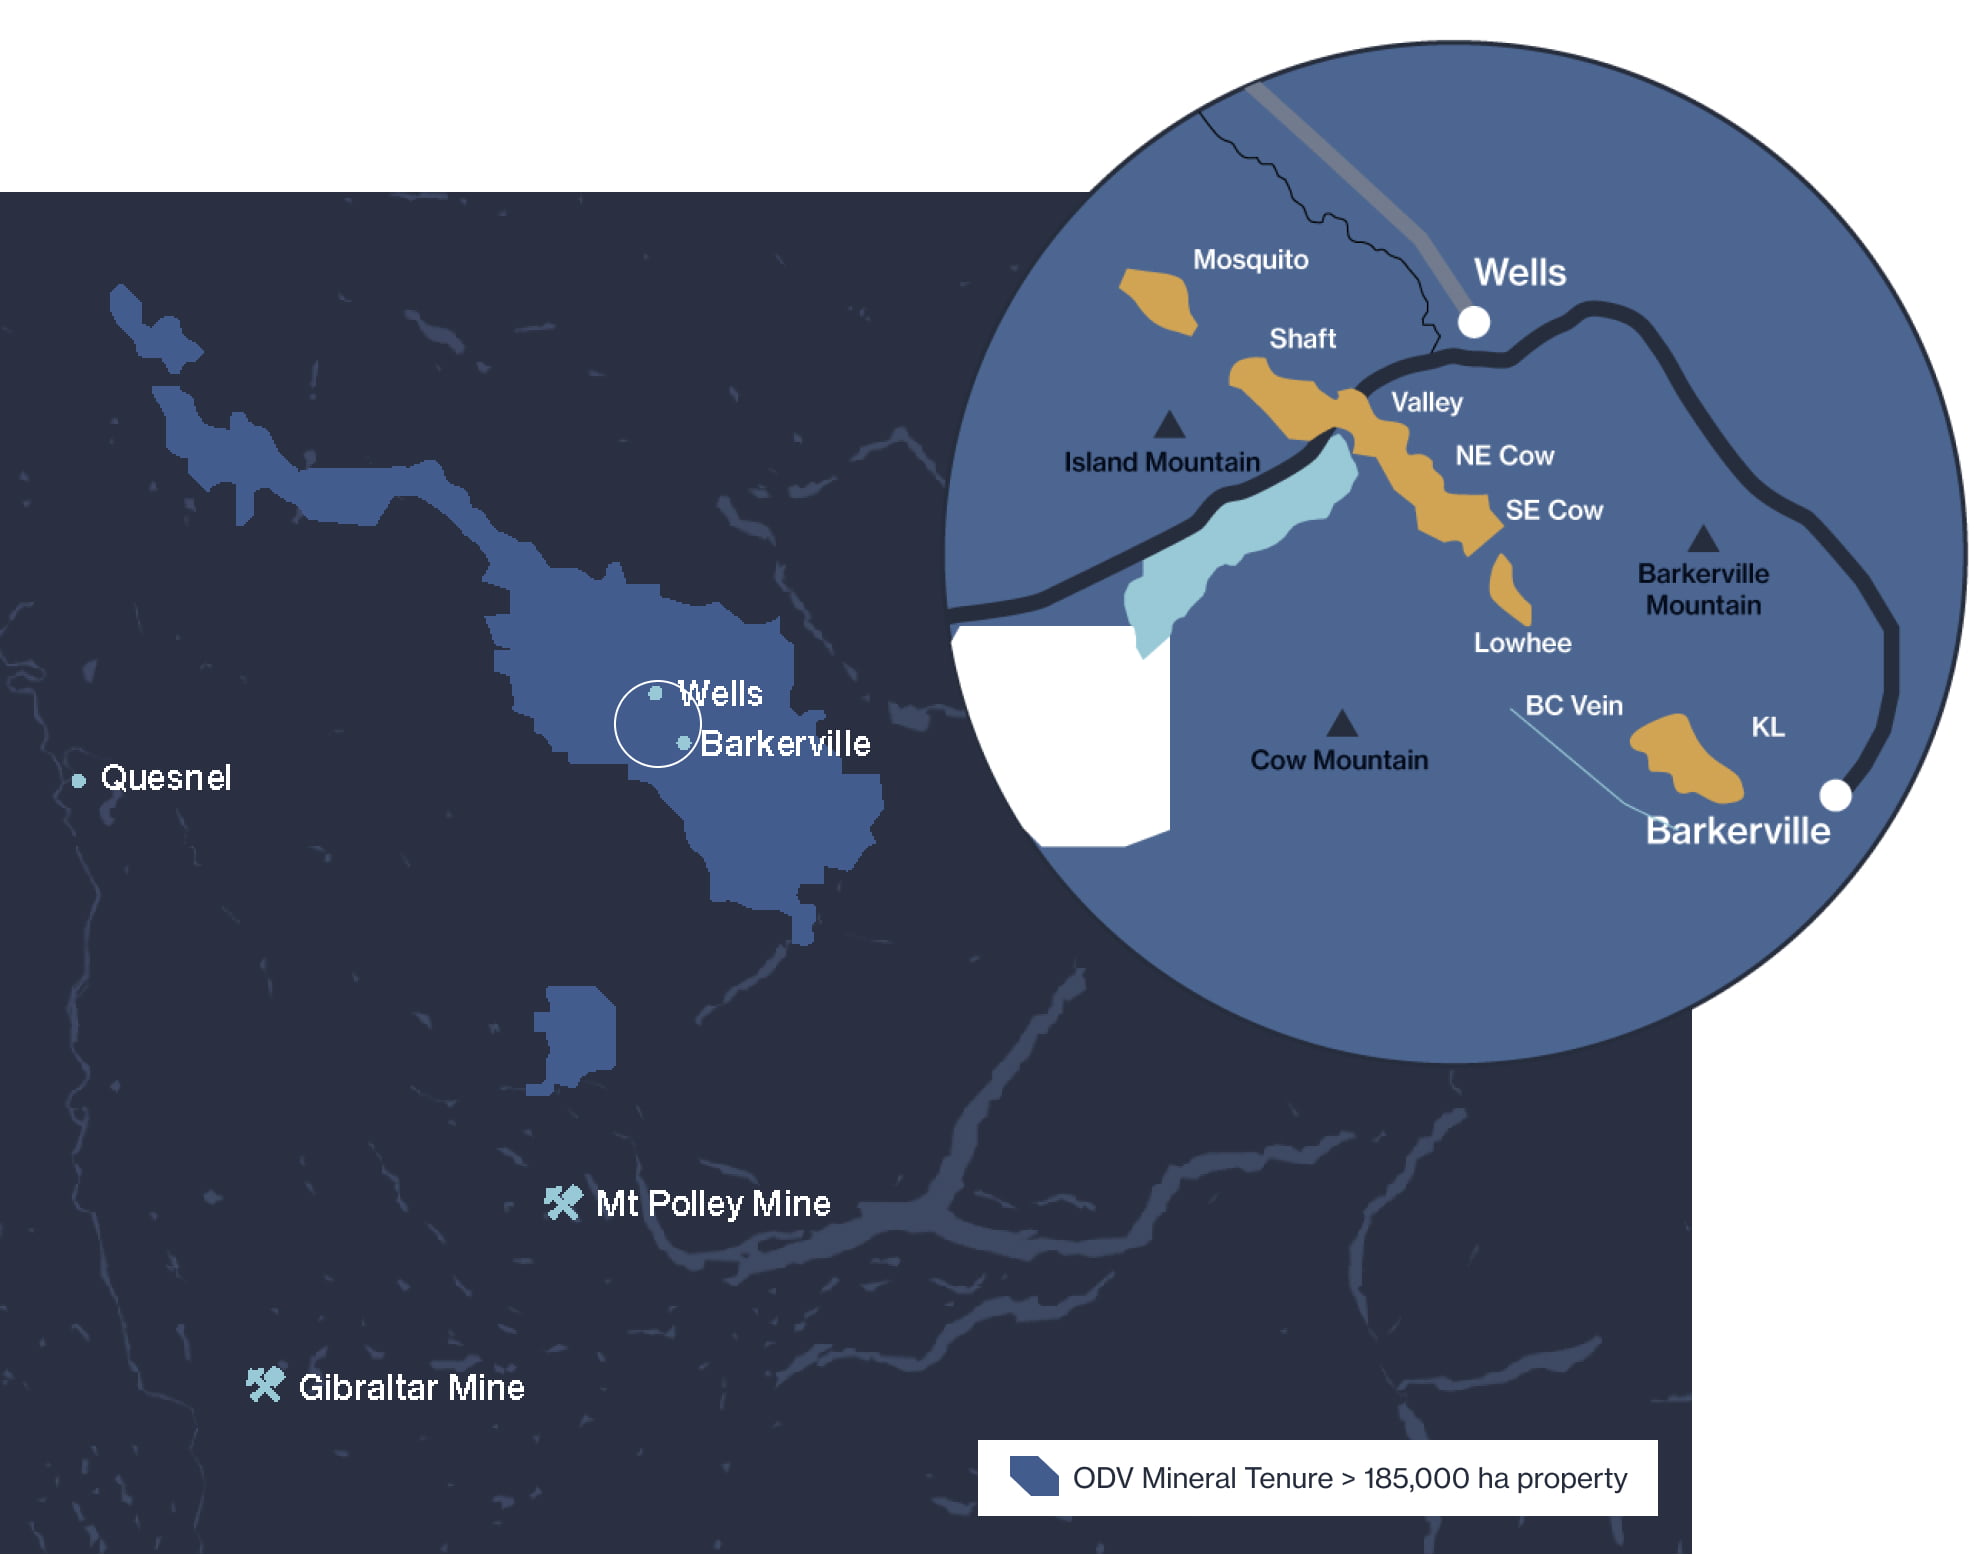
Location
British Columbia, Canada
British Columbia, Canada
Ownership
100%
100%
Mine Type
Underground
Underground
Land Package
~192,000 hectares
~192,000 hectares
Metals
Gold, Silver
Gold, Silver
Project Status
Shovel ready (permits granted Q4 24)
Shovel ready (permits granted Q4 24)

Overview
A Feasibility Study on the Cariboo Gold Project, released in April 2025, envisions a robust and scalable underground operation expected to produce approximately 1.89 million ounces of gold over a 10-year mine life, with an after-tax NPV5% of C$943 million and 22.1% IRR at a US$2,400/oz gold price (after-tax NPV5% of C$2,066 million and 38.0% IRR at a US$3,300/oz gold price). The Project received an Environmental Assessment Certificate on October 10, 2023, in accordance with the BC Environmental Assessment Act (2018). Receipt of the EA Certificate successfully concluded the EA process for the Project, which was launched in October 2019. The Company was granted the BC Mines Act and Environmental Management Act permits in Q4 2024.
Feasibility Study
April 2025
The scientific and technical information related to the 2025 Feasibility Study ("2025 FS") relating to the Cariboo Gold Project is supported by the 2025 FS which was prepared in accordance with NI 43-101 with an effective date of April 22, 2025 and will be filed on SEDAR+ (www.sedarplus.ca) and on EDGAR (www.sec.gov) under Osisko Development's issuer profile within 45 days of the date of April 28, 2025. For readers to fully understand the information in this news release, reference should be made to the full text of the Technical Report, once filed, including all assumptions, qualifications and limitations therein. The Technical Report is intended to be read as a whole, and sections should not be read or relied upon out of context. Refer to ODV news release dated April 28, 2024. The 2025 FS has been prepared by independent representatives of BBA, InnovExplo, a subsidiary of Norda Stelo, Alius, Falkirk, WSP, Okane, Integrated Sustainability, Clean Energy, and JDS, each of whom is a "qualified person" (within the meaning of NI 43-101) (each, a "QP").
Table 1: Cariboo Feasibility Study Highlights
| Cariboo Gold 2025 FS vs. 2023 FS – Project Operating and Financial Metrics | |||
|---|---|---|---|
| Assumptions | units | 2023 FS | 2025 FS |
| Gold price | US$/oz | 1,700 | 2,400 |
| Exchange rate | USDCAD | 1.30 | 1.35 |
| Discount rate | % | 5.0% | 5.0% |
| Production | |||
| Mine life | yrs | 12.0 | 10.0 |
| Total ore mined | kt | 16,703 | 17,815 |
| Peak annual throughput | tpd | 4,900 | 4,900 |
| Average gold head grade | g/t Au | 3.78 | 3.62 |
| Total contained gold | koz | 2,031 | 2,071 |
| Avg. gold recovery | % | 92.0% | 92.6% |
| Total recovered gold, payable | koz | 1,869 | 1,894 |
| Avg. gold production, LOM | koz/yr | 164 | 190 |
| Avg. gold production, first 5 yrs | koz/yr | 96 | 202 |
| Operating Unit Costs | |||
| Underground mining | $/t mined | 53.6 | 62.3 |
| Processing | $/t mined | 31.2 | 23.2 |
| Water and waste management | $/t mined | 7.2 | 5.0 |
| Electrical transmission line | $/t mined | — | 4.9 |
| General and administrative | $/t mined | 10.7 | 15.4 |
| Total unit operating costs | $/t mined | 102.6 | 110.7 |
| Total operating costs | $ mm | 1,714 | 1,921 |
| Royalty payments | $ mm | 206 | 292 |
| Offsite charges | $ mm | 5 | 143 |
| Operating Costs | |||
| Total cash costs2 | US$/oz | $792 | $947 |
| AISC2 | US$/oz | $968 | $1,157 |
| Capital Expenditures | |||
| Initial costs | $ mm | 137.3 | 881 |
| Expansion costs | $ mm | 451.1 | — |
| Sustaining costs | $ mm | 466.6 | 426 |
| Closure costs, net3 | $ mm | (38.9) | 99 |
| Total capex | $ mm | 1,016 | 1,406 |
| Economics (after-tax) | |||
| Total free cash flow, LOM2 | $ mm | 901 | 1,577 |
| Net Present Value (NPV5%) | $ mm | 502 | 943 |
| Internal Rate of Return (IRR) | % | 20.7% | 22.1% |
| Payback, from commercial production | yrs | 5.9 | 2.8 |
| Average free cash flow, first 5 yrs2 | $ mm | (63) | 296 |
| Average free cash flow, LOM2 | $ mm | 75 | 158 |
Scroll right to view more
Table 2: Economic Sensitivities to Gold Price (base case in bold)
| Cariboo Gold 2025 FS – Economic Sensitivity Analysis, after-tax (base case in bold) | ||||
|---|---|---|---|---|
| Gold Price | NPV5% | IRR | Payback | Avg. FCF |
| (US$/oz) | ($ mm) | (%) | (yrs) | ($ mm per yr) |
| $1,800 | 251 | 9.9% | 5.3 | 65 |
| $2,100 | 610 | 16.5% | 3.5 | 113 |
| $2,400 | 943 | 22.1% | 2.8 | 158 |
| $2,700 | 1,275 | 27.2% | 2.2 | 204 |
| $3,000 | 1,604 | 31.9% | 1.9 | 250 |
| $3,300 | 1,934 | 36.3% | 1.7 | 296 |
| $3,600 | 2,263 | 40.5% | 1.5 | 342 |
| $3,900 | 2,592 | 44.5% | 1.3 | 388 |
| $4,200 | 2,921 | 48.3% | 1.2 | 433 |
| $4,500 | 3,249 | 51.9% | 1.1 | 479 |
Scroll right to view more
Mineral Reserves & Resources
Mineral Resources Estimate (April 22, 2025) – Exclusive of Mineral Reserves
The Mineral Resources estimate included in the 2025 FS have an effective date of April 22, 2025, and are reported exclusive of Mineral Reserves. Mineral Resources that are not Mineral Reserves do not have demonstrated economic viability. There is no certainty that Mineral Resources will be converted into Mineral Reserves. Mineral Resources include Inferred Mineral Resources which have had insufficient work to classify them as Indicated Mineral Resources. It is uncertain but reasonably expected that Inferred Mineral Resources could be upgraded to Indicated Mineral Resources with continued exploration. The Mineral Resources estimate follows the 2014 CIM Definition Standards on Mineral Resources and Reserves and the 2019 CIM Estimation of Mineral Resources and Mineral Reserves Best Practice Guidelines.
| Mineral Resources | Measured Resources | Indicated Resources | Inferred Resources | ||||||||
|---|---|---|---|---|---|---|---|---|---|---|---|
| Deposit | Tonnes (000’s) |
Grade (g/t Au) |
Ounces (koz Au) |
Tonnes (000’s) |
Grade (g/t Au) |
Ounces (koz Au) |
Tonnes (000’s) |
Grade (g/t Au) |
Ounces (koz Au) |
||
| Bonanza Ledge | 47 | 5.06 | 8 | 32 | 4.02 | 4 | — | — | — | ||
| BC Vein | — | — | — | 1,057 | 3.00 | 102 | 596 | 3.17 | 61 | ||
| KL | — | — | — | 527 | 2.80 | 47 | 2,514 | 2.53 | 205 | ||
| Lowhee | — | — | — | 1,333 | 2.76 | 118 | 486 | 3.01 | 47 | ||
| Mosquito | — | — | — | 1,553 | 2.96 | 148 | 1,883 | 3.08 | 186 | ||
| Shaft | — | — | — | 6,121 | 2.92 | 575 | 7,457 | 3.44 | 826 | ||
| Valley | — | — | — | 2,718 | 2.70 | 236 | 2,470 | 3.01 | 239 | ||
| Cow | — | — | — | 3,991 | 2.91 | 374 | 3,368 | 2.78 | 301 | ||
| Total Resources | 47 | 5.06 | 8 | 17,332 | 2.88 | 1,604 | 18,774 | 3.09 | 1,864 | ||
Scroll right to view more
Mineral Reserves Estimate (April 10, 2025)
Mineral Reserves were classified in compliance with the CIM Definition Standards for Mineral Resources and Mineral Reserves. As such, the Mineral Reserves are based on Measured and Indicated Mineral Resources and do not include any Inferred Mineral Resources. Measured and Indicated Mineral Resources are exclusive of proven and probable reserves. Mineral Reserves are the estimated tonnage and grade of ore that is considered economically viable for extraction.
Mineral Reserves for the Project deposit incorporate dilution and mining recovery factors based on the selected mining method and design. In addition, economic analyses were completed to validate the profitability of particular areas of the reserves.
| Cariboo Gold 2025 FS – Mineral Reserves Statement (April 10, 2025) | |||
|---|---|---|---|
| Category / Zone | Tonnage | Gold Grade | Contained Gold |
| (tonnes) | (g/t) | (oz) | |
| Proven | — | — | — |
| Probable | |||
| Cow | 3,999,971 | 3.35 | 430,548 |
| Valley | 3,238,636 | 3.59 | 374,058 |
| Shaft | 8,548,295 | 3.72 | 1,021,599 |
| Mosquito | 1,105,370 | 3.94 | 140,102 |
| Lowhee | 923,162 | 3.52 | 104,491 |
| Total Proven & Probable | 17,815,435 | 3.62 | 2,070,798 |
Scroll right to view more
Project News
View AllJul
21
2025
Jul
7
2025